Quest #3 is Quest #7 on 21 things for students
Cell Phone Usage Student Activity
Your teacher has been contacted by an advertising agency that represents several cell phone companies. Your job is to investigate the data of a typical middle school student and their phone usage. The data needs to be graphed and analyzed so that the companies can create new usage packages for the middle-school-aged customers and their families.
Please use the given data to create a profile of Sean Smith’s phone usage. Then create a graph to represent each set. Once you graph the results you will be asked to draw conclusions from the information. A tutorial has been provided above to help you with this activity, and here is a downloadable document of this Quest here:
Cell Phone Usage Student Activity
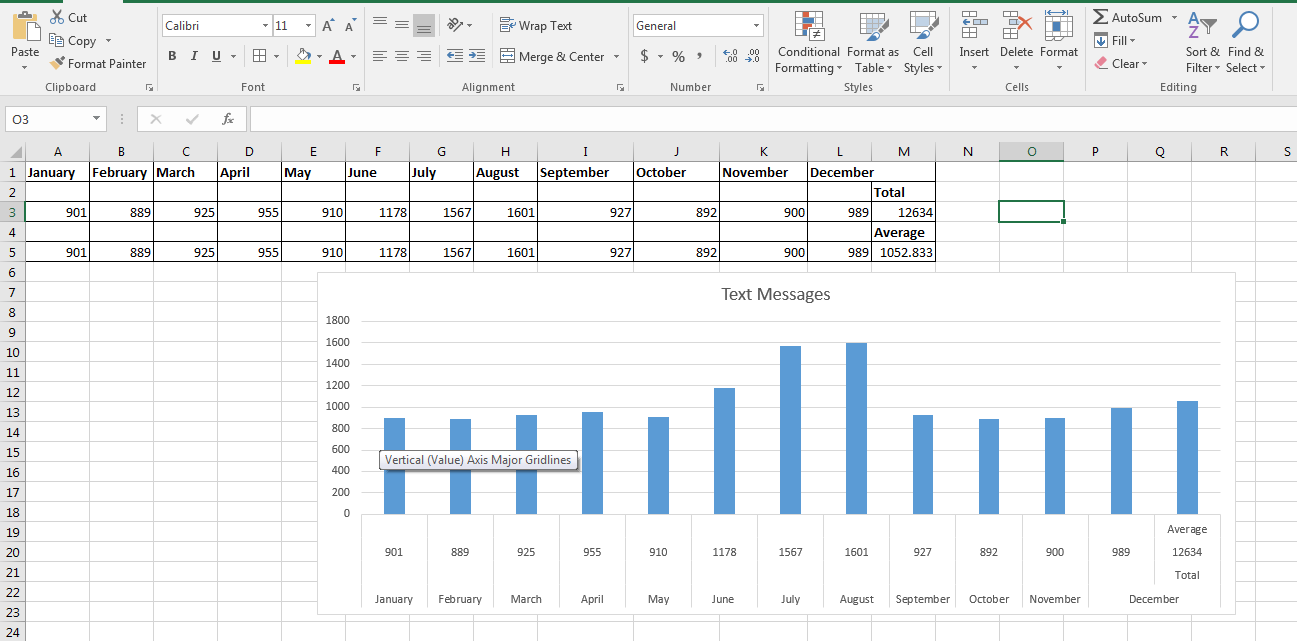
Your teacher has been contacted by an advertising agency that represents several cell phone companies. Your job is to investigate the data of a typical middle school student and their phone usage. The data needs to be graphed and analyzed so that the companies can create new usage packages for the middle-school-aged customers and their families.
Please use the given data to create a profile of Sean Smith’s phone usage. Then create a graph to represent each set. Once you graph the results you will be asked to draw conclusions from the information. A tutorial has been provided above to help you with this activity, and here is a downloadable document of this Quest here:
Once you have completed the two excel pages (cell phone usage & text messages) take a screen shot of each and post to your weebly.
In a text box answer the following questions:
1. How many months did Sean exceed the average?
2. Which representation was the most useful? The excel bar graph or the numbers on the spreadsheet? Why?
3. What type of a package would you suggest for a family with a middle-school-aged student based on the information you gathered?